I was working on a simple C++ program where I enter a series of x/y coordinates to display with SciPlot, and thought it would be nice to have the x and y planes defined with horizontal and vertical lines, if the coordinates crossed the zero boundaries. That’s when I ran into a brick wall of sorts.
This is a followup to the post Casual Bessel Exploration, but only marginally related. Looking at the information on SciPlot, I was able to discover nothing that would allow the easy creation of horizontal or vertical lines. Additionally, I then discovered that queries to AI can generate responses and functions that don’t really exist, such as: “plot.hline(0)” This is not a real function of sciplot::plot. A cautionary note for folks that may believe AI is the “cat’s meow.” The point is if AI cannot find an answer, it may use other avenues or programs to fill in. In other words, AI can lie.
Well, that led me down the path of discovering a way to generate something that should have been simple. And that’s what this short post is about. I will include the C++ program snippets that accept x/y coordinates; and uses SciPlot to display in a window. I will depict the several short commands that generate the horizontal and vertical lines in that same window. It uses the algorithm header to find the minimum and maximum values of the vectors so the lines extend through the entire window’s boundaries.
So, we begin by entering several pairs of x/y coordinates, such as would be depicted on graph paper. These coordinates are placed in two vectors, one for horizontal and one for vertical. To have the horizontal and vertical lines extend completely across the window, we need to determine the minimum and maximum values entered. This where the algorithm STL1 comes into play. I have included it in the program, although it shouldn’t really be necessary as most STLs are included in the C++ standard library. Either way the program compiles. However, I have noticed several Internet sites which depict the command as std::max_element(), but this statement is not part of the std library.
Now, we show the short series of statements used to determine the min/max values. It is not particularly compact, as I tested each step one at a time.
The last line is used twice to supply the other vector element for both horizontal and vertical plotting. Then, to make the lines part of the generated plot, we use these lines:
The .label(““) statement at the line end removes the unwanted legends for the two lines. As the vectors accept double numbers, and the min/max lines are integers, it may be necessary in some cases to extend the horizontal and vertical lines by adding 1 (+/-) to the values. I have not done that in the program.
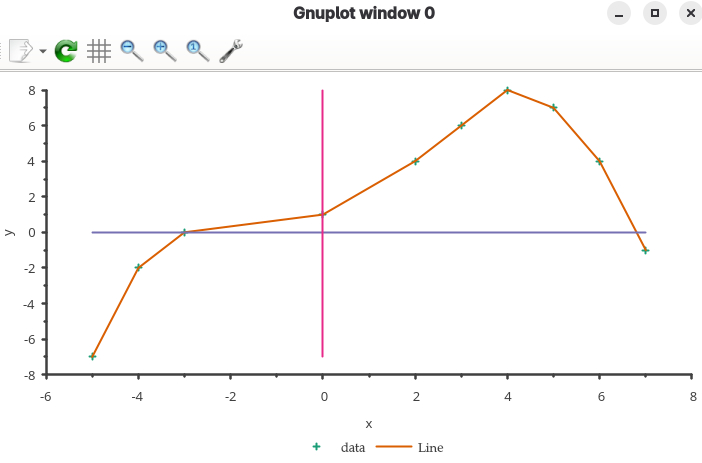
So, what does all this lead up to? Here is a sample to show the result including the vertical and horizontal lines:
Horizontal and vertical lines on plot.
It is quite possible there is some command or statement in SciPlot that does the very thing I have described in this post, and I have not discovered it yet. If so, that is my fault and no one elses. If there is not, then this is one possible avenue to overcome that deficiency. In any case, it is what it is.
That’s all for this short dissertation. We always praise God for all things, even those things we may be less than pleased with, as God’s Plan is far beyond what we are able to understand. As it says in 1 Corinthians 3:18-21:
   18 Let no man deceive himself. If any man among you seemeth to be wise in this
      world, let him become a fool, that he may be wise.
   19 For the wisdom of this world is foolishness with God. For it is written,
      He taketh the wise in their own craftiness.
   20 And again, The Lord knoweth the thoughts of the wise, that they are vain.
   21 Therefore let no man glory in men.
Footnotes
The C++ Standard Template Library (STL) is a collection of template classes and functions that provide common data structures and algorithms, such as vectors, lists, and sorting functions.↩︎