Code
#include <iostream>
#include <vector>
#include <limits>
#include <cmath>
#include <string>
#include <map>
#include <iomanip> // for setprecision()
#include <sciplot/sciplot.hpp>I’m trying to remember just how this started, but the beginnings are shrouded in yesterday… From Wikipedia:
Bessel functions are a class of special functions that commonly appear in problems involving
wave motion, heat conduction, and other physical phenomena with circular or cylindrical symmetry.
They are named after the German astronomer and mathematician Friedrich Bessel, who studied
them systematically in 1824.
The most important cases are when \(\alpha\) is an integer, where the resulting Bessel functions are often called cylinder functions or cylindrical harmonics because they naturally arise when solving problems (like Laplace’s equation) in cylindrical coordinates.
In the electronics arena, Bessel functions are primarily for signal processing, particularly in the design of Bessel filters, which are known for their maximally flat group delay, which preserves the wave shape of filtered signals. Other applications involve wave propagation and heat conduction in cylindrical systems, such as electromagnetic waves in waveguides and sound vibrations in circular membranes, like a drumhead. Also, they have broad application for quantum mechanics. Much more in-depth information is found here. So at what are we looking for this adventure?
\[Value = -1^{k} \times \frac{(x/2)^{n+2k}}{\gamma(k+1) * \gamma(n+k+1)}\]
where we will iterate k from 0 to 1001, then sum each result for the final value. The \(\gamma\) (tgamma) function in C++ computes the gamma function of a specified value, which is a generalization of the factorial function. For natural numbers, \(\gamma(n)\) returns the factorial of (n-1).
UPDATE: Thinking back on the above formula, it might be a bit more familiar if it were shown as follows:
\[Jv(x) = \sum^{\infty}_{k=0} \frac{(-1)^{k}}{\gamma(k+1) \gamma(k+v+1)} \biggl(\frac{x}{2}\biggr)^{2k+v}\]
Some depictions show \(\gamma\) as \(\Gamma\). So, what I decided to try was automating this in C++. I started with the basic function to calculate a single example value for Bessel order 0, for x of 1, giving this:2 \(Bessel function J_0(1) = 0.7651976866\)
Well, that was a great start, but less than invigorating. So I decided to take it to the next step and do a series of numbers. So I created some code to enter a range of discrete values, such as 0.1, 0.2, 0.3, 0.4, 0.5, giving this:
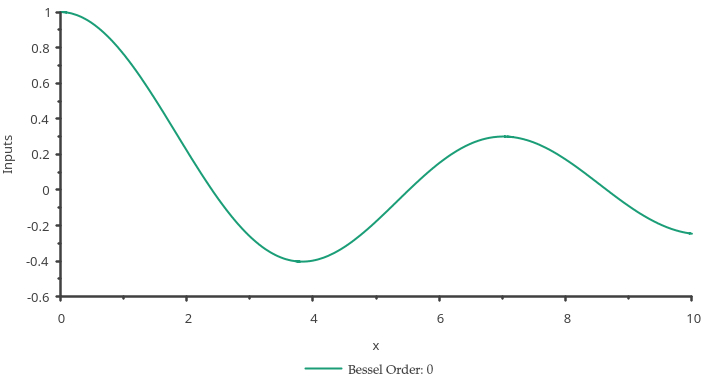
From that point, the project seemed to snowball! Next, I thought, “Wouldn’t it be nice to enter a range of values without manually typing lots of values. Well, that was more interesting, but what did it look like? So that started the ball rolling on using sciplot to generate the data points, and gnuplot to display in a nice image. So, here is a display using values of order 0, with a x range of 0 - 10:
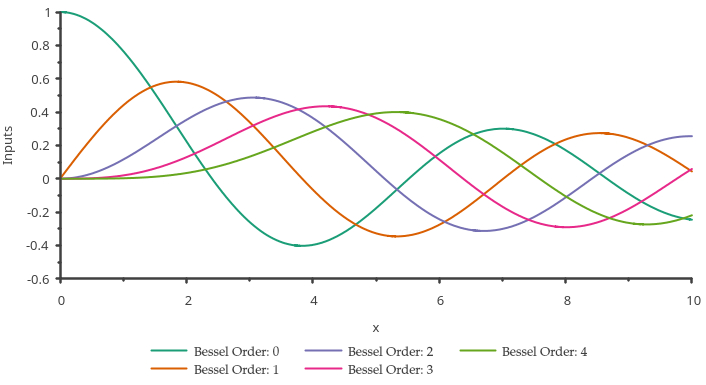
On the Internet, I found a diagram with multiple plots on the same image, so decided that functionality would also be useful. So, having already added single and multiple data point entry, I added multiple order entry functionality. About that time I realized I didn’t want calculated data points to clutter up the screen, unless x inputs were manual, where I wished to know actual values. So that was added. Then, let’s say we desired to display the values for Bessel orders from 0 to 4, for a range of input values from 0 to 10, and display all on a single plot. This is the result:
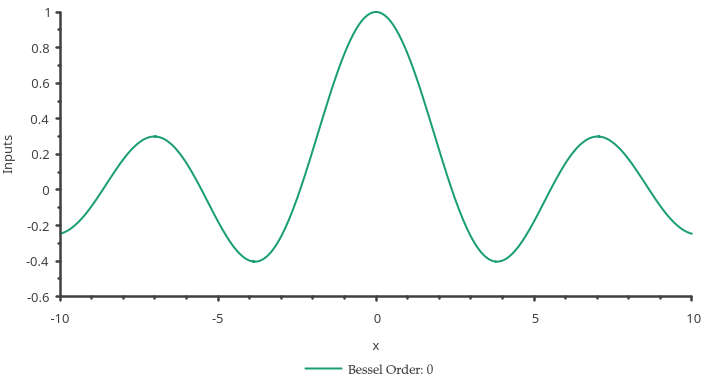
Then it starts to get really interesting. If we wished to see a two-dimensional cross-section of a vibrating membrane, or a pebble dropped into a lake, would it look like this?
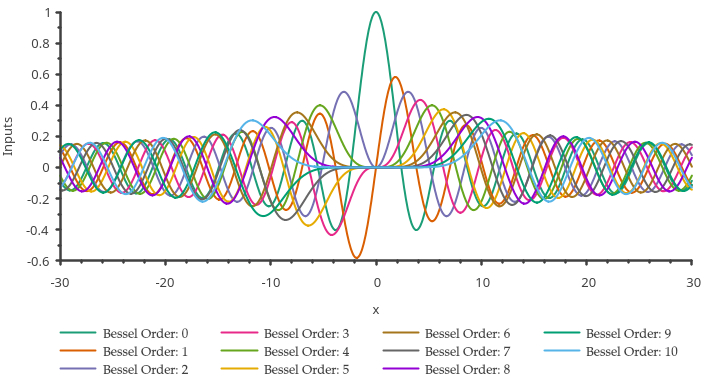
Now, just for fun, here is a wildly overpopulated (busy) diagram for some lovely eye candy.
I suppose that’s enough images to get an idea of what this little C++ program currently does. I suspect I should get into the actual program… Most programs, I use using namespace std;. In this program, I use using namespace sciplot;. The libraries needed for this to work are:
#include <iostream>
#include <vector>
#include <limits>
#include <cmath>
#include <string>
#include <map>
#include <iomanip> // for setprecision()
#include <sciplot/sciplot.hpp>
Next, the function doing the actual calculation is as follows:
double besselFunction(int n, double x) { // calculate bessel value
    double sum = 0.0;
    for (int k = 0; k <= 100; ++k) {
        double term = pow(-1, k) * pow(x / 2, n + 2 * k) / (tgamma(k + 1) * tgamma(n + k + 1));
        sum += term;
    }
    return sum;
}
The term in the above function, I hope I correctly depicted at the top of this page in the Value formula. The main() function is now presented.
std::cout << "\033[2J\033[1;1H"; // clear screen
std::cout << "======================================\n";
std::cout << "=   Calculate Bessel values of \'x\'   =\n";
std::cout << "======================================\n";
std::vector<double> inputs; // store step sizes
int Otype{}, Vtype{}; // selection variables
std::map<std::string, std::vector<double>> vectorMap; // Map of vectors: key and name
double input{}, result{};
int order{}, orderStart{}, orderEnd{};
std::cout << "Select:\n\t1) Multiple orders.\n\t2) Single order.\n";
std::cin >> Otype;
if(Otype == 1) { // multiple orders
    std::cout << "Order start: "; std::cin >> orderStart;
    std::cout << "Order end: "; std::cin >> orderEnd;
} else {
    std::cout << "Enter the order of the Bessel function: ";
    std::cin >> order;
}
// Value input type selection
int n{1000}; // range resolution
double start{}, end{};
std::cout << "Input type:\n\t1) Discrete values.\n\t2) Value range.\n";
std::cin >> Vtype;
if(Vtype == 1) { // discrete value entry
    std::cout << "Enter \'x\' values (type 'q' to quit): " << std::endl;
    while (std::cin >> input) {
        inputs.push_back(input);
    }
} else { // range of values from start/end
    std::cout << "Enter start: "; std::cin >> start;
    std::cout << "Enter end: "; std::cin >> end;
    std::vector<double> vec(n); // temporary vector for step size
    double step = (end - start) / (n - 1); // Calculate the step size
    for (int i = 0; i < n; ++i) {
        vec[i] = start + i * step; // Fill the vector
    }
    inputs = vec; // copy vector
}
std::cin.clear(); // Clear the error flag
std::cin.ignore(std::numeric_limits<std::streamsize>::max(), '\n'); // Ignore the rest of the line
std::cout << "\033[2J\033[1;1H"; // clear screen
if(Vtype == 1) { // show only for discrete value entry
    std::cout << "You entered:\n";
    for (const auto& value : inputs) { // iterate through range values
        std::cout << value << " ";
    }
    std::cout << std::endl; // clear buffer
}
std::setprecision(10); // show 10 digits
if(Otype == 1) { // multiple orders
    // Creating vectors with dynamic names
    for (int i = orderStart; i <= orderEnd; ++i) {
        vectorMap["J" + std::to_string(i)] = std::vector<double>(); // Initialize vectors as double
        if(Vtype == 1) std::cout << "For order: " << i << std::endl; // show only for discrete value entry
        for (const auto& value : inputs) { // for Jx
            result = besselFunction(i, value);
            if(Vtype == 1) std::cout << "Result(" << value << "): " << result << std::endl; // show only for discrete value entry
            vectorMap["J" + std::to_string(i)].push_back(result); // Adding calculated values for each vector
        }
    }
} else {
    if(Vtype == 1) { // show only for discrete value entry
        std::cout << "For order: " << order << std::endl;
        std::cout << "\nCalculated Bessel values of \'x\':\n";
    }
    vectorMap["J" + std::to_string(0)] = std::vector<double>(); // Initialize single vector as double
    for (const auto& value : inputs) { // for J0
        result = besselFunction(order, value);
        if(Vtype == 1) std::cout << "Result(" << value << "): " << result << std::endl; // show only for discrete value entry
        vectorMap["J" + std::to_string(0)].push_back(result); // Adding values
    }
}
After all that, we now show the statements to construct the plotted image.
// Create a Plot object
Plot2D plot;
// Set the font name and size
plot.fontName("Palatino");
plot.fontSize(10);
// Set the x and y labels
plot.xlabel("x");
plot.ylabel("Inputs");
// Set some options for the legend
plot.legend()
    .atOutsideBottom()
    .fontSize(10)
    .displayHorizontal();
// Plot the Bessel functions
if(Otype == 1) { // multiple orders
    for (int i = orderStart; i <= orderEnd; ++i) { // loop to generate plots to display in one window
        plot.drawCurve(inputs, vectorMap["J" + std::to_string(i)]).label("Bessel Order: "+std::to_string(i));
    }
    Figure fig = {{plot}}; // Create figure to hold plot
    Canvas canvas = {{fig}}; // Create canvas to hold figure
    canvas.size(720, 400); // width and height of canvas
    canvas.show(); // Show the plot in a pop-up window
} else {
    plot.drawCurve(inputs, vectorMap["J" + std::to_string(0)]).label("Bessel Order: "+std::to_string(order));
    Figure fig = {{plot}}; // Create figure to hold plot
    Canvas canvas = {{fig}}; // Create canvas to hold figure
    canvas.size(720, 400); // width and height of canvas
    canvas.show(); // Show the plot in a pop-up window
}
I made little attempt to streamline the code, and there is some duplication, as I was simply trying to get a working program. Is it time now?
Disclaimer: I am no C++ programmer, I just like to dabble a bit for the fun of it.
Anyway the above program is presented with no apologies or any sort of suitability for any purpose, just for my entertainment. So, Enjoy!
Have a great day, and may God Bless you and yours. If you haven’t given your life to Jesus (Yeshua), there’s no time like the present. Until there’s no more time! For a start, try this website, or here for some inspiration. Bye!