Checking Stocks Using R
Many years ago, I dabbled in the stock market just for the fun of it. However, after getting married, I really didn’t have much time for that, so essentially got out!
Trading stocks can absorb a significant amount of your time, depending on whether you day trade, or just buy and sell ocasionally. Either way, you must invest at least some time in research of stocks you may be interested in purchasing (or divesting). I ended up in the more technical aspects of trading, such as trend analysis and prediction.
Recently, having gotten into learning the ins-and-outs of R programming, I happened to run across an article by Gracia Harjanto concerning “Analyzing stocks using R” where she used R packages ‘quantmod’ and ‘xts’ (among others) to analyze a stock’s performance and simulated direction. I was thinking, “What can I do with this using R?”
Her article revolved around using Yahoo as the vehicle to obtain historical data on stocks. Sometimes, it seems the data from Yahoo is not the most consistent or accurate. I have seen where there are values that don’t match what I knew from personal experience. Therefore, I wanted to attempt to use data from Alpha Vantage instead.
Alpha Vantage provides data free of charge, although limits searches to five per minute. That is not really a hurdle as I can, for instance, download Bollinger Band, SMA, MACD, and Daily data just fine. As it usually takes much more than a minute to absorb the data, not a problem! Their only requirement is obtaining an API key to access the data.
Bollinger bands are calculated as standard deviations above and below an average based on closing prices. The premise is the bands widen and narrow as the price trend becomes more or less volatile. When the bands narrow it may indicate sharp price changes to follow, which is another way of saying, for narrow bands, supply and demand are in a fine state of balance. All band changes are relative to the recent past and may indicate a breakout. If the price exceeds a band it may indicate the trend will continue. What this usually indicates is when the price traces out a reversal formation after it has crossed outside a band, expect a trend reversal.
By the way, SMA is Simple Moving Average, MACD is Moving Average Convergence Divergence and can be an indicator or signal for buying or selling. MACD needs a human behind the decision to do either, as ‘algorithym trading’ has created havoc for the stock market in the past. “Algo Trading” refers to market transactions that use advanced mathematical models to make high-speed trading decisions. These days, it is believed about 80 percent of trading is done by machines according to a recent CNBC article.
The MACD is a form of trend deviation indicator using two MAs, the shorter being subtracted from the longer, where more recent periods are weighted heavier than a simple MA. The third EMA (exponential moving average) is known as the ‘signal line’ where the crossovers signal buy or sell. It is a popular tool, but is just another variation of a trend-deviation indictor that uses two EMAs as its method.
Before I get started, I wish to make very clear what I am attempting to do here with R is for fun, as I am NOT an R Programmer (or Data Scientist) by any means. This is one of the methods I am using to get a small grasp on what R is capable of doing, and to further my knowledge. Admittedly, this and other things I am using R for can be better done with Python or C++, for example. But, I want to see if I can do it with R.
Listed below are the packages I am using for this program. If you use ‘tidyverse,’ you don’t need to load ‘dplyr,’ as it loads with it. It’s always good to keep a pair of pliers in your toolbox.
library(alphavantager) # for av_get.
library(ggpubr) # for annotate, ggarrange.
library(lubridate) # for date conversions.
library(dplyr) # for filtering tables.
library(stringr) # for string manipulations.
The structure of the program starts with loading the packages above, then setting up for retrieval of a selected stock’s data. Before you can use Alpha Vantage’s data service, you must go to the website and acquire your own API key as mentioned above. I am lazy about typing all caps so I use the ‘toupper()’ function to change it for me. The script then asks if you want new data, or existing data. Existing data is used for looking at different periods without downloading the data each time. To facilitate that, as soon as the new data is downloaded, it saves it to disk in a subdirectory, which you can edit for your choice in the script. In this script, the tables downloaded are BBANDS, SMA, Daily and MACD. If existing data is desired, the script first checks in that directory to determine if there is in fact any data to retrieve.
You are then asked for start and end ranges for the data you wish to examine in greater detail. Lubridate functions are used to allow partial dates to be entered, such as 2009-01-05, or 2009-03, or 2009. If the start date is not given, it loads all data from the beginning. If an end date is likewise omitted, it loads all data up to the current download’s date. One day’s data could be loaded and shown, but would not serve to show much trending.
After the subrange data frames are created based on your entered dates, the program creates the plots and combines them into one graphic for display. Just before that, the head of each table is shown in the terminal for further use or examination. One item to keep in mind is not all data downloaded starts in the past and ends in the present. Some data is loaded with the head as the most recent and the tail as most distant. The daily data is loaded the opposite way, with the most recent at the tail of the data frame.
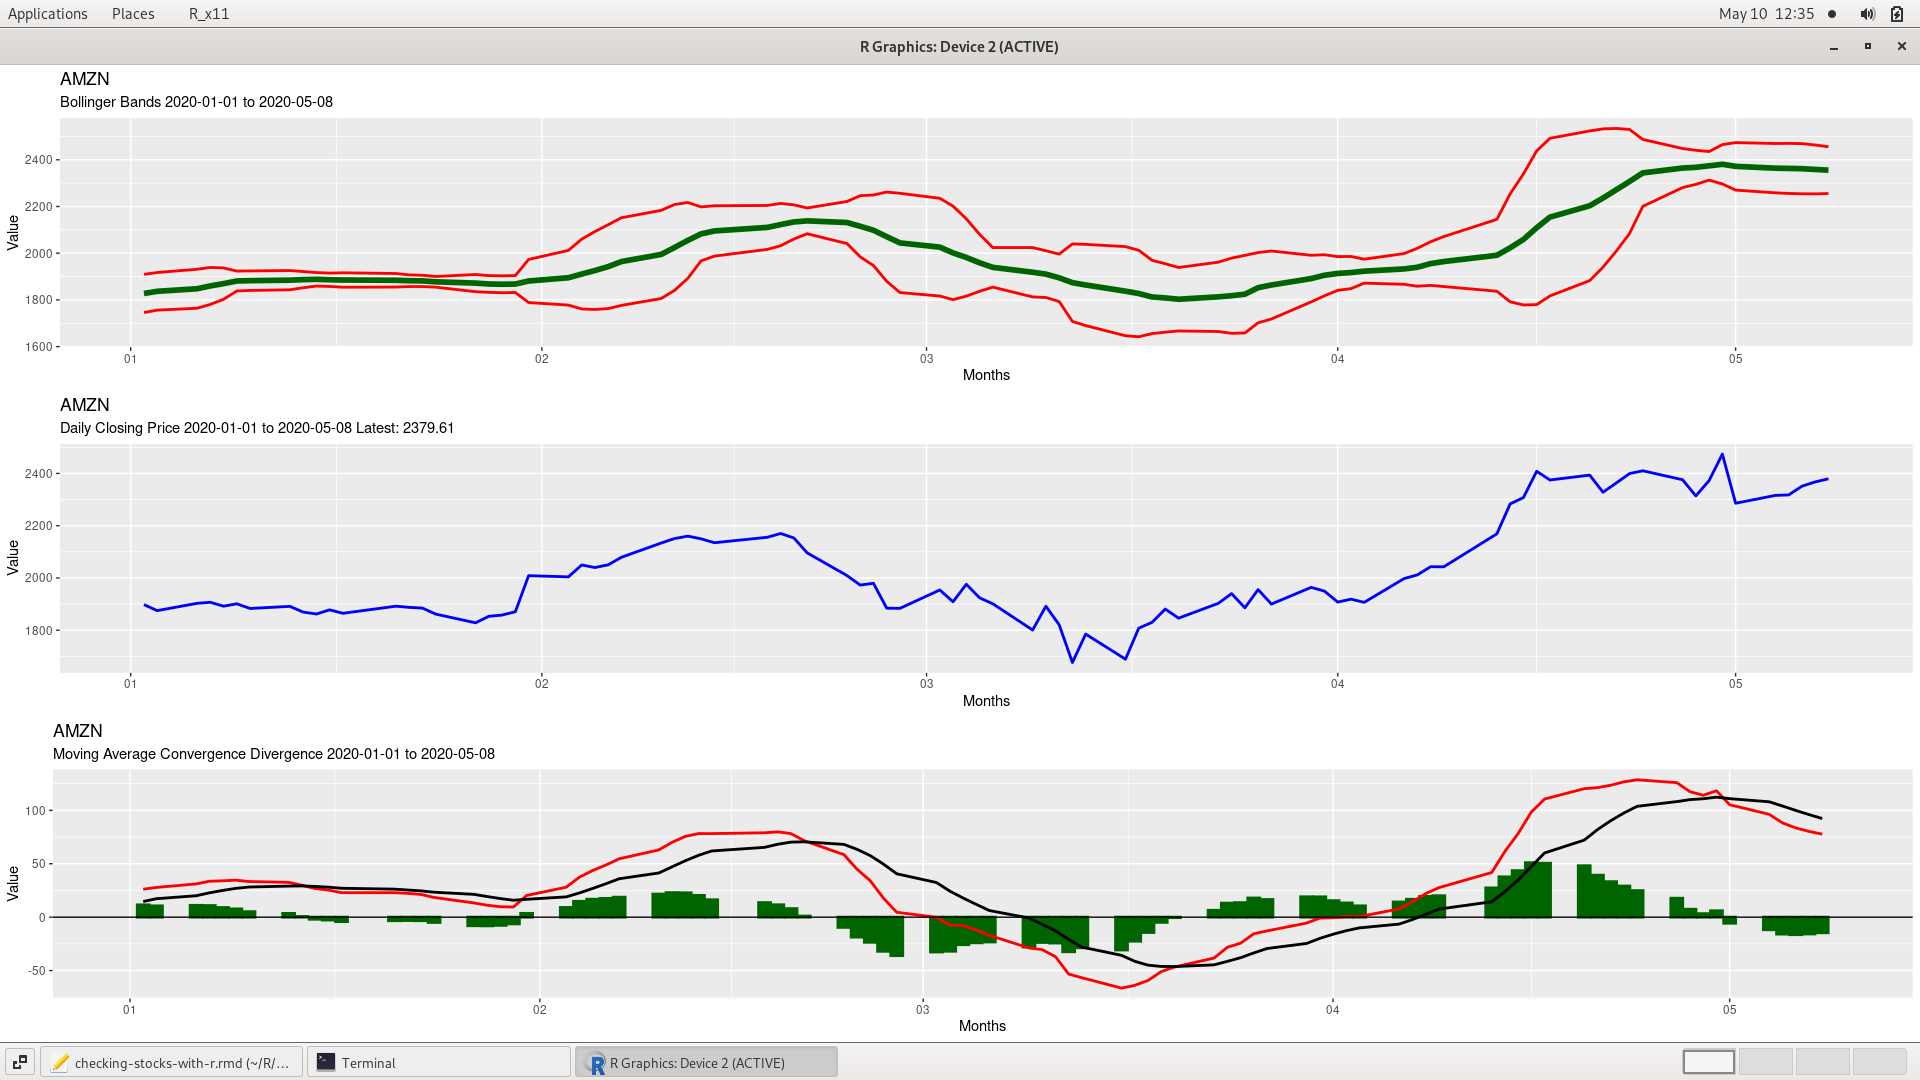
By right-clicking the above image, you can ‘view image’ to see greater detail of what’s included in the plot. It would be trivial to include the daily price changes on the bollinger plot to see the deviations instead of the average. I may do that in a subsequent version. This program could easily be bettered by R programmers that are more familar with R than I, and I’m sure be made much more efficient. However, for me, I plug along until I get something to work like I want it to look or perform. All part of the learning process.
The entire program, less the API key is shown here UPDATE: The code described here now identifies as a Premium path, instead of a free path to stock data.